Data: The information or facts or values which are
numerical, collected with definite purpose iscalled data.
e.g.:
Record of every day temperature
for a month of June of city .
Runs scored by cricketer in matches.
Statistics:Statistics deals with collection,
presentation, and analysis of data.
Types of data:
Primary data: The data collected by investigator personally
is called primary data.
Secondary data: The information gathered from a source which
already had the record,is called secondary data.
Arrangement of DATA:
Raw data: The data which is not arranged in any way is
called raw data.
e.g.
The score of cricketer in matches
10,20,20,10,30,10,30,10,20,10,20,
Range: Difference between highest and lowest value
in data is the range of data.
e.g.
For data:
Range = highest value-lowest value
Ungrouped frequency table:
Given
data:
The
table representing data as following wayis called ungrouped frequency table :
|
Marks
|
No. of students
|
|
10
|
5
|
|
20
|
4
|
|
30
|
2
|
|
total
|
11
|
Grouped frequency table:
Given
data: .
The table representing data as following way is
called grouped frequency table:
|
Marks
|
No. of students
|
|
11-20
|
6
|
|
21-30
|
7
|
|
31-40
|
2
|
|
41-50
|
2
|
|
Total
|
17
|
Class Interval:
The
grouping of data into small groups is called class interval or classes.
e.g. , etc. are the classes or the data.
Class limits:
Upper class limit: The highest value of class is called upper
class limit.
Lower class limit: The lowest value class limit of the class is
called lower class limit.
Class width: The difference between upper and lower limit
of the class is called class width
or
length of class interval.
Inclusive class interval(non
overlapping classes): The classes etc.
are non overlapping classes as no class
limit overlap with other.
The
values included in class are
values between and
, including and
.
Exclusive type class intervals: For
the classes etc. the upper class limit of previous class and
lower class limit of next class overlap.Such classes are called exclusive
classes.
Here
the class includes
the values less than , exclude the value .
The
value is
included in class .
Class
mark:
Class
mark is mid point of the class interval.
It
is calculated by
Graphs:
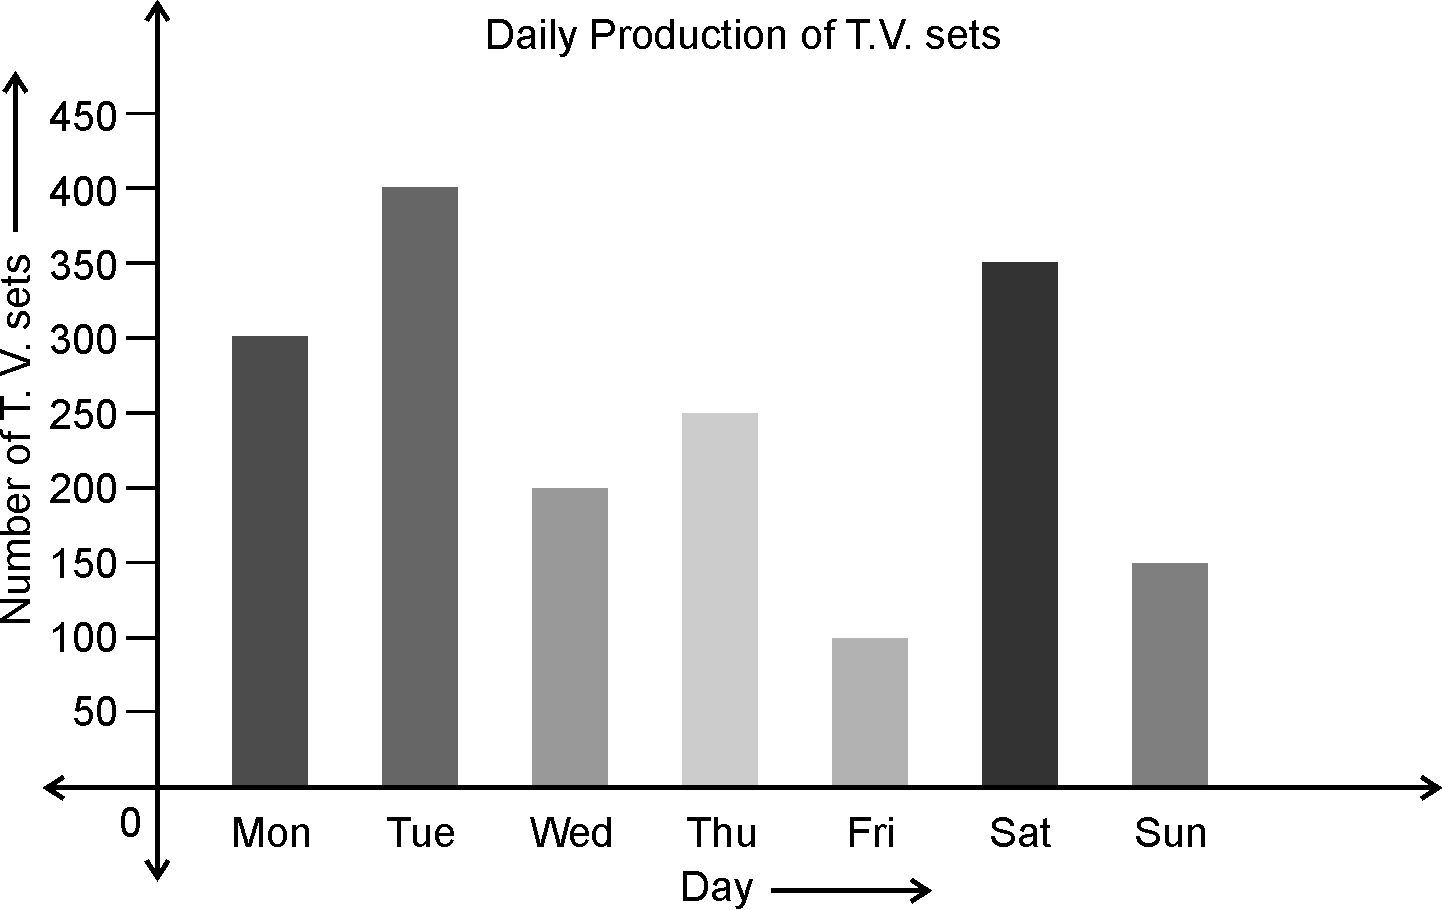
1)Bar graphs: Representation of data
using bars of equal width and with uniform spacing
between them.The height of bars is in
proportion to the frequency.
This is used
when all classes are of equal length.
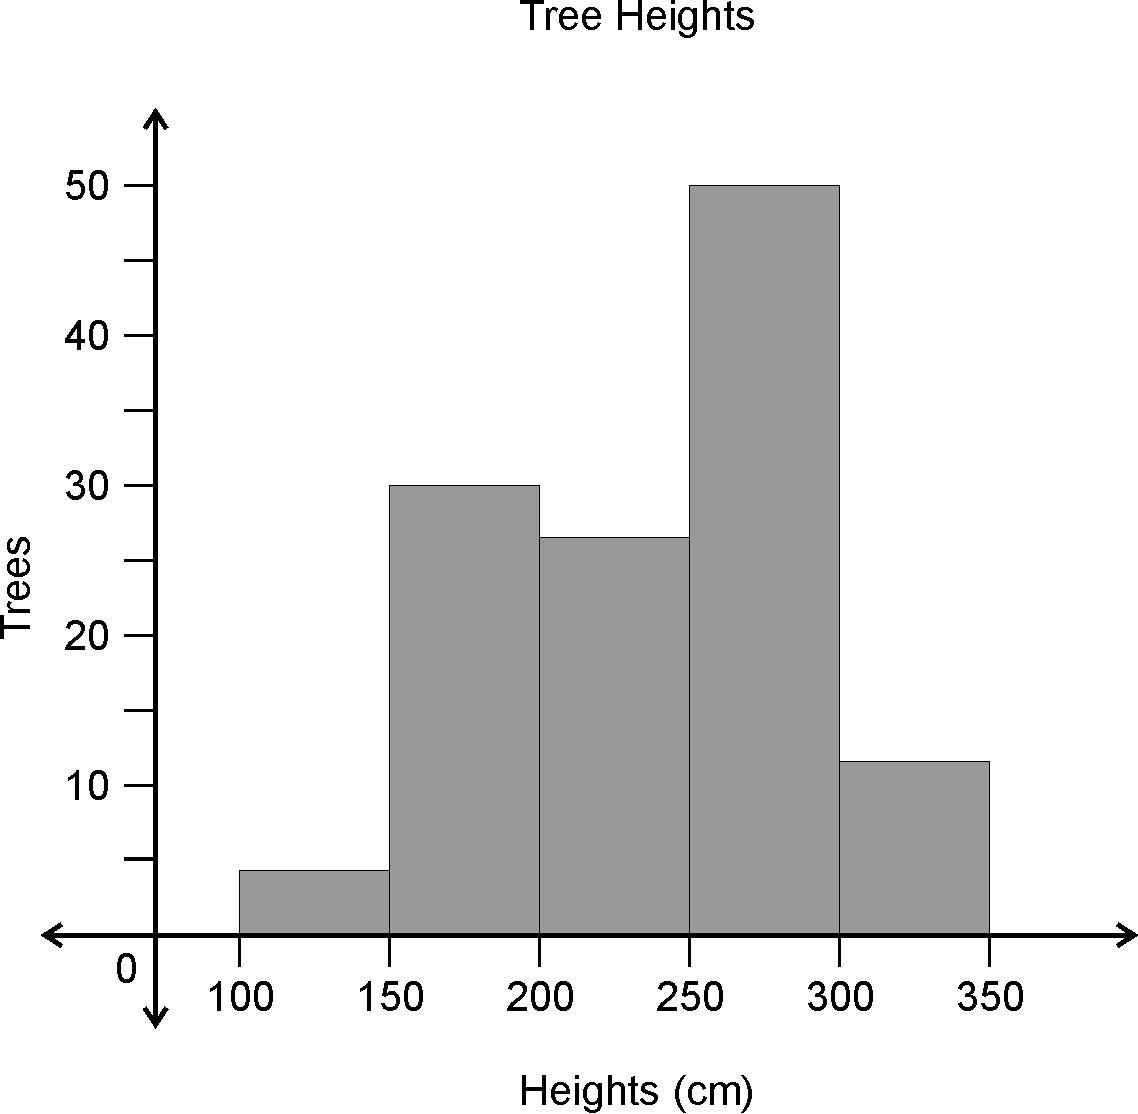
Histogram:
The
representation of data with the rectangles,whose breadth is proportional to class-width
andlength is proportional to frequency of that class interval
This
can be used when we have unequal class interval
Frequency polygon:
When
the points with coordinates as (class mark,frequency) are plotted and joined
with straight line, the graph so obtained is called the frequency polygon.

Measures of central tendency:
Mean : It is average of data.
i) For ungrouped data, mean
ii) For ungrouped frequency table, mean
Median:
Median
isthe middle value of data when data is arranged in ascending order.
If total
number of observations.
i) When is odd,
Median observation
ii) When even
Median
Mode: It is the value which occurs most frequently
or it is the value with highest frequency.