support@tutormate.in   022 6236 4602

07 Graphical Representation of Motion

DISTANCE-TIME GRAPH

The distance time graph of a body moving at uniform speed is always a straight line.

DISPLACEMENT TIME GRAPH

Consider the following graph.

displacementTime Graph

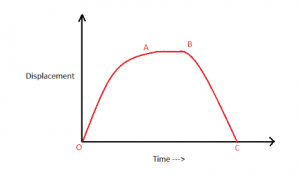
In order to analyze the motion we consider three segments OA, AB and BC.

  • Mathematically velocity is represented as:
v = dxdt
  • dxdt

    gives the slope of the  displacement time graph and that is equal to the velocity.

    • In segment OA slope is positive and decreasing with time. So, velocity is positive and decreasing with time.
    • In segment AB slope is zero and so velocity is zero in this region.
    • In segment BC, slope is negative and so velocity is also negative.
  • Displacement time graph can also go below the x-axis unlike distance time graph which cannot go below x-axis as distance is always positive.

SPEED-TIME GRAPHS (OR VELOCITY-TIME GRAPHS)

  • Velocity-time graph: It is the graph obtained by plotting velocity of the body along Y-axis and time along X-axis.
  • There are three types of speed-time graph for a moving body. These three cases are:
    • Speed – Time Graph when the Speed Remains Constant i.e. with no acceleration
    • Speed – Time Graph when Speed Changes at a Uniform Rate i.e. with uniform acceleration.
    • Speed – Time Graph when the body changes in a non-uniform way i.e. with non-uniform acceleration.

CASE 1: SPEED – TIME GRAPH WHEN THE SPEED REMAINS CONSTANT

The speed –time graph of a body is a straight line parallel to the time axis.

case1Speed

CASE 2: SPEED – TIME GRAPH WHEN SPEED CHANGES AT A UNIFORM RATE

  • The speed-time graph for a uniformly changing speed (or uniform acceleration) will be a straight line.
  • The value of acceleration from the speed-time graph of a moving body.
case2UniformRate
  • In a speed- time graph of a body, a straight line sloping downwards  indicates uniform retardation.
case2UniformRate2

CASE 3: SPEED-TIME GRAPH WHEN SPEED CHANGES AT A NON-UNIFORM RATE (NON-UNIFORM ACCELERATION)

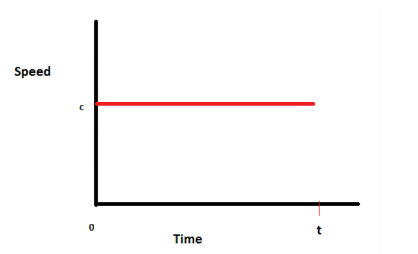
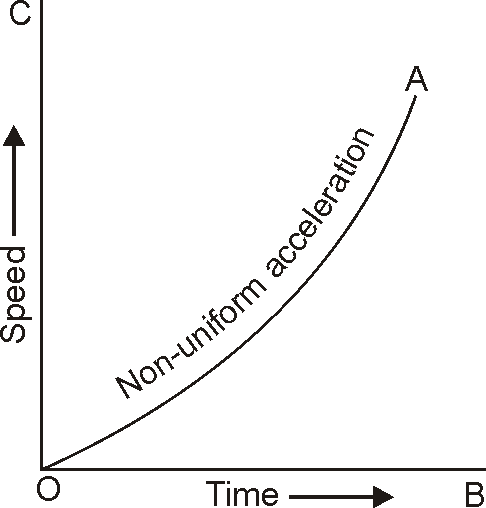
When the speed of the body changes in an irregular manner, then the speed-time graph of the body is a curved line.

case3

VELOCITY-TIME GRAPH

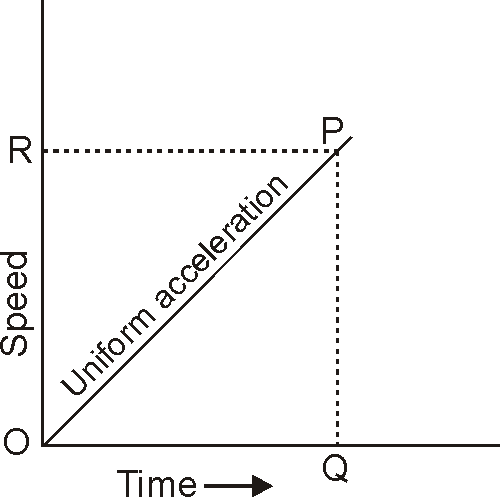
Consider the following velocity-time graph:

velocity

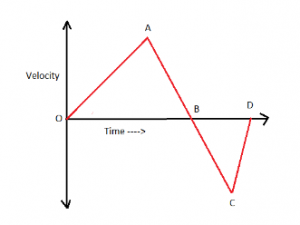
Acceleration is the rate of change of velocity represented as:

a = dvdt

In other words, slope of the velocity time graph represents acceleration. In the given graph, acceleration is positive in OA and CD while it is negative in the region AC. Also the velocity changes direction at B.

We know that,

dx =  vdt

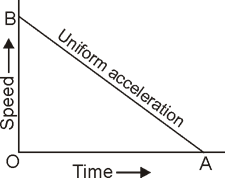
Graphically it means area under velocity-time graph represents displacement.
So,

Displacement = Area of OAB  Area of BCD

.

Velocity time graph can also go below x-axis but not speed time graph because speed is never negative.

Start your learning Journey !

Tutormate-googleplay
Tutormate-AppleStore
Get SMS link to download the app